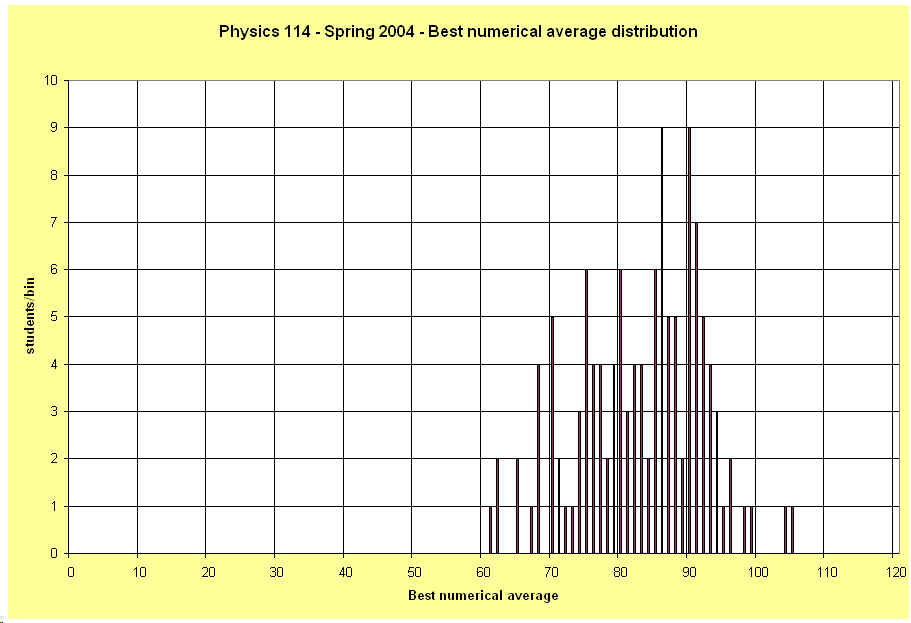
P114 Fall 2004, best numerical average distribution
Having taken your exam grades and scaled them to have a mean of 70, I calculated your average five different ways as laid out in the syllabus.
Below is the letter grade cutoffs I applied to the curve. If you attended 7 or more workshops and were within one point of a boundary, I gave you the higher letter grade.
>92=A, >89=A-, >86=B+, >78=B, >75=B-, >72=C+, >63=C, >55=C-